The intoxication subacute of ammoniacal nitrogen in the nutrition of the dairy cow of high production
The nitrogen metabolism in dairy cows:
(by M. Wattiaux – Babcock Institute for International Dairy Research and Development University of Wisconsin – 2014)
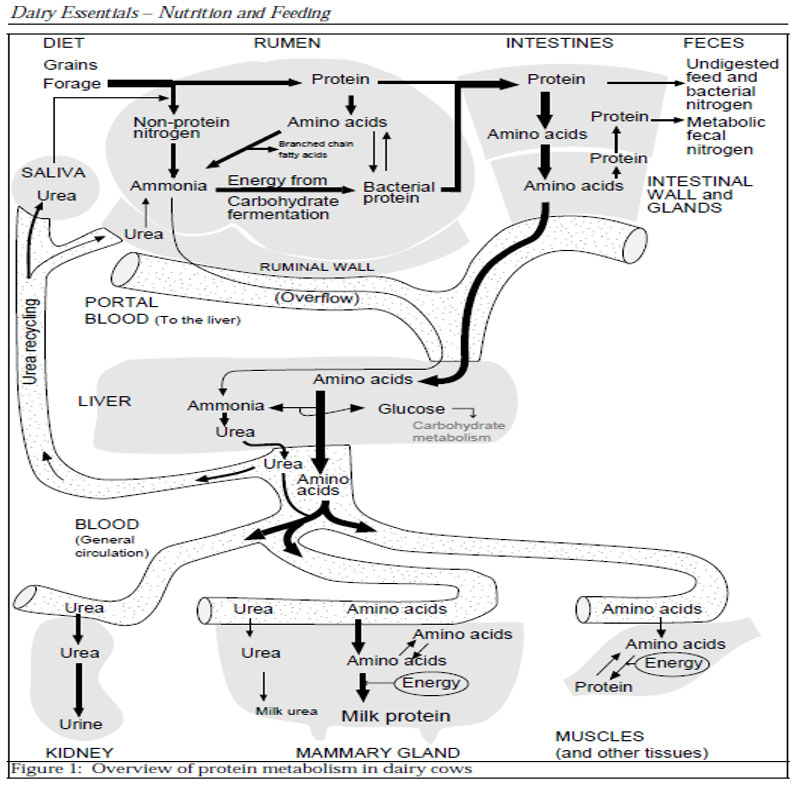
The nitrogen metabolism in dairy cows:
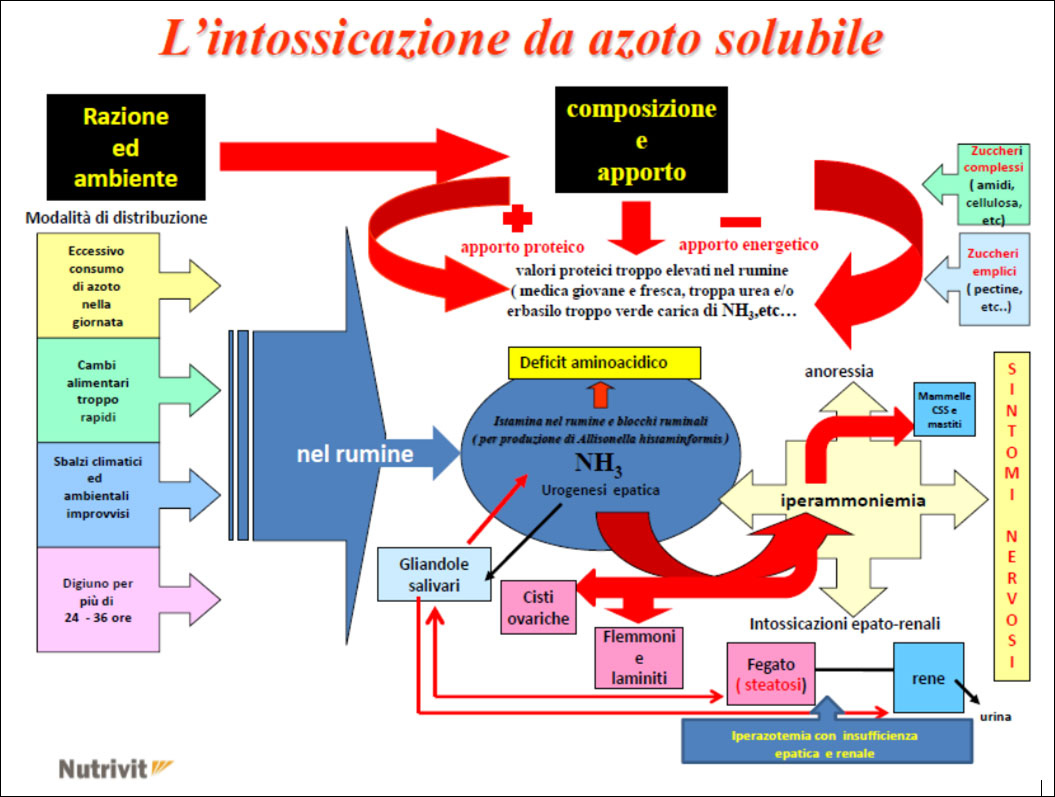
The ruminal pH change caused by a sudden and / or sharp increase in rumen soluble nitrogen (protein imbalance), resulting in:
- one excessive ingestion of highly soluble fresh protein fodder (ex: excessive doses of green pasture rich in soluble nitrogen such as alfalfa and / or clover, etc …)
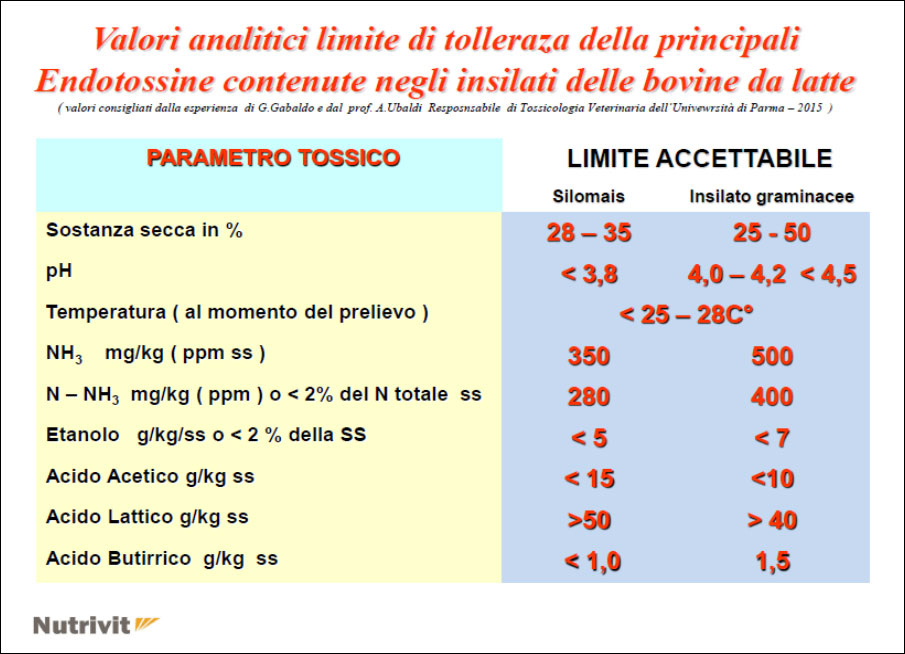
- the use of high doses of silage with a high content of NH3 in free form in the ration, etc … causes both a soluble nitrogen poisoning in the rumen which can also be followed by an acute alkalosis (but only on some subjects) and more as one increase in ammoniacal nitrogen at a ruminal habitat followed by one metabolic level of NH3 (subacute form) which then, in practice, is also the most damaging for economic purposes as it covers the whole herd
Effects on animal health and production:
This situation at rumen level creates the ideal conditions for the development of the Allisonella histaminiformans, a ubiquitous microorganism of the rumen producing histamine that results in:
- the immediate inflammation of the rumen papillaes (due to increased circulating cytokines) and consequent reduction in the assimilation of AGVs (Volatile Fatty Acids) followed by the activation of diseases affecting:
- udder (increase in the infimmatory state in the breast and consequently more CSS and mastitis)
- feet (formation of thrombus at amatic level >> interdigital phlegmon >> laminitis)
- ovaries (ovarian cysts)
- in some animals the acute form (acute alkalosis) may also occur with diseases affecting:
- liver (hepatic steatosis)
- of the kidneys (nephritis)
and in severe forms - CNS (neuroplegic symptoms with ataxia, impaired gait etc … and in some cases coma and death of subject Struck)
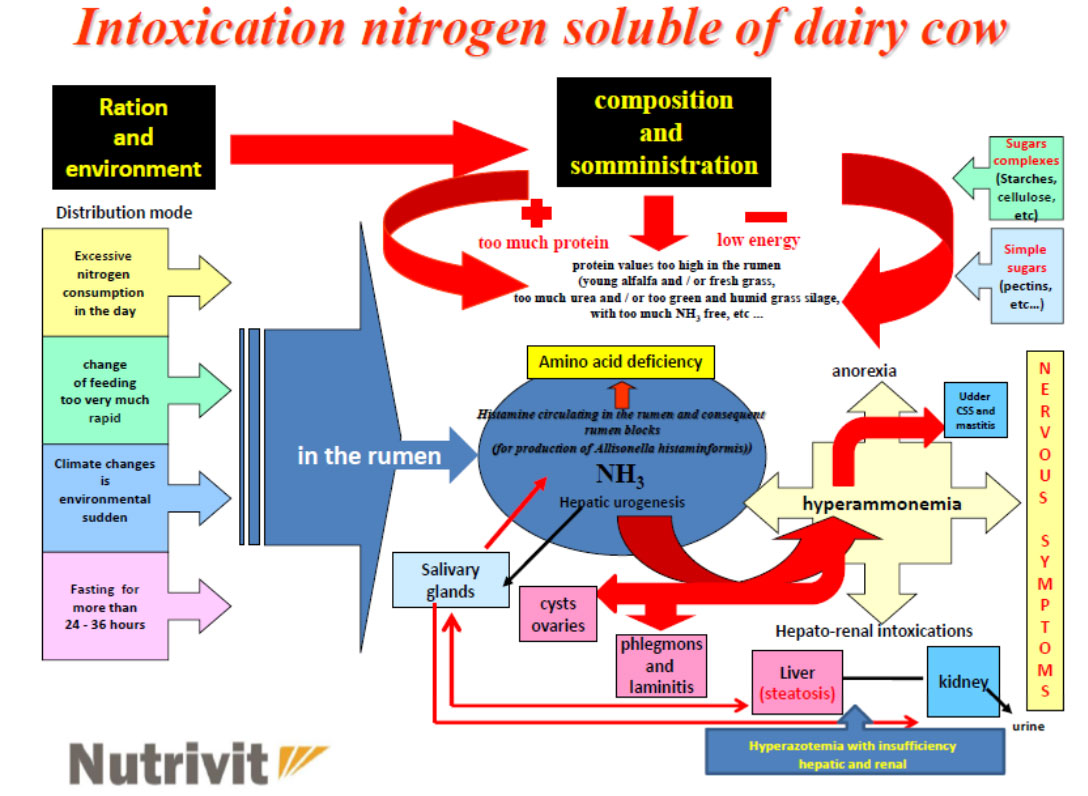
Actions to be taken on the ration for the subacute forms to improve the health, reproduction and production of cows:
- Elimination and / or reduction of the toxic nitrogen food source ( green grass, grass silage, urea, etc …) and
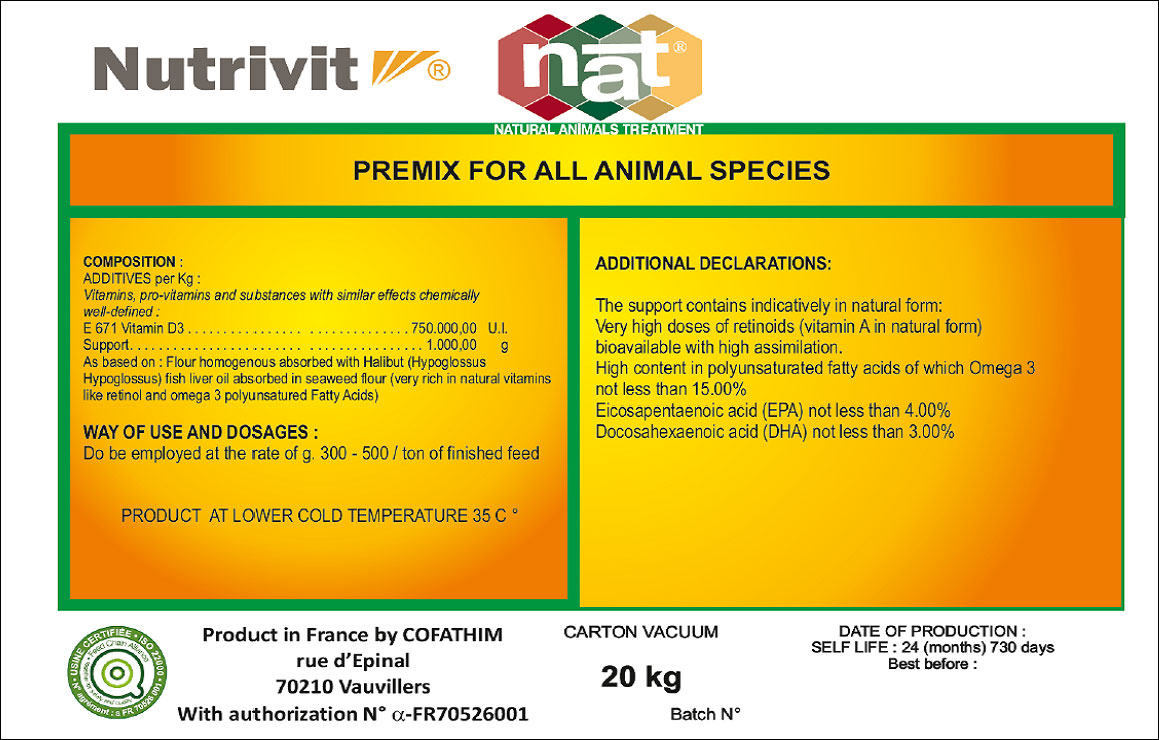
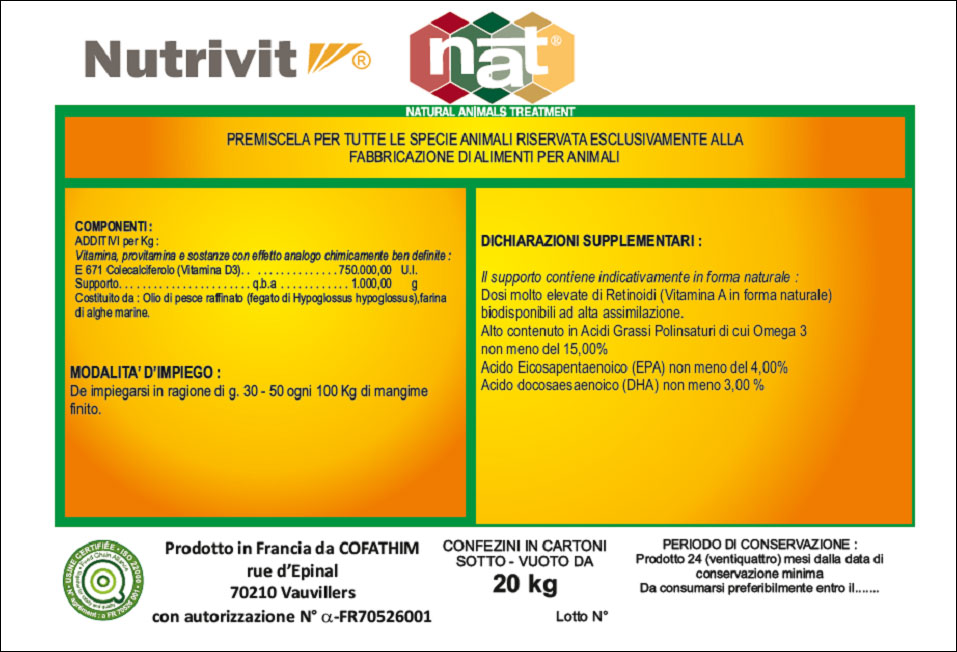
add the following mix to the ration - mix of sodium propionate 100 g / head / day + 20 g. / head/ days of Micronil ® (ProbioactiFAP®) + ANTIGRIP FEED (NUTRIVIT-COFATHIM phytotherapic with an anti-inflammatory action ) 50g./head/days This mix must be administered until the end of the use of the “toxic” ( ex: grass silage ) feed source in the diet and continue for at least another 10 days and continue for at least another 10 days.
BIBLIOGRAPHICAL REFERENCES
– Anon. Third External Review Draft of Air Quality Criteria for Particulate Matter (April, 2002). Volume I, II. EPA. United States Department of Environmental Protection Agency. www.epa
– Bach A., Calsamiglia, S. and Stern, M.D. 2005. Nitrogen Metabolism in the Rumen J. Dairy Sci., 88: 9 – 21 Baker, L.D., J.D. Ferguson, and C.F. Ramberg. Kinetic analysis for urea transport from plasma to milk in dairy cows. J. Dairy Sci. 75 (Supplement 1):181, 1992.
– Baker, JL, 2001. Limitations of improved nitrogen management to reduced nitrate leaching and increase use efficiency. Optimizing Nitrogen Management in Food andEnergy Production and Environmental Protection: Proceedings of the 2 nd International Nitrogen Conference on Science and Policy. The Scientific World 1(S2), 1016.
– Cowling, E., J. Galloway, C. Furiness, M. Barber, T. Bresser, K. Cassman, J.W. Erisman, R.Haeuber, B. Howarth, J. Melillo, W. Moomaw, A. Mosier, K. Sanders, S. Seitzinger, S.Smeulders, R. Socolow, D. Walters, F. West, and Z. Zhu. 2001. Optimizing nitrogen management in food and energy production and environmental protection: Summary Statement from the Second International Nitrogen Conference. TheScientificWorld 1(S2): 19. DePeters, E.J. and J.D. Ferguson. 1992. Nonprotein nitrogen and protein distribution in the milk of cows. J. Dairy Sci. 75:31923209.
– Dou, Z., D.T. Galligan, C.F. Ramberg, Jr., C. Meadows, and J.D. Ferguson. 2001. A survey of dairy farming in Pennsylvania: Nutrient management practices and implications. J. Dairy Sci. 84:966973.
– Ferguson, J.D., Z. Dou, and C.F. Ramberg, Jr. 2001. An assessment of ammonia emissions from dairy facilities in Pennsylvania. TheScientificWorld 1(S2): 348355. Erickson, G.E. and T.J. Klopfenstein. 2001. Nutritional methods to decrease N losses from opendirt feedlots in Nebraska. TheScientificWorld 1(S2): 836843.
– Ganong, W.F. Review of Medical Physiology. Nineteenth edition . Co 1999. Appleton and Lange a Simon & Schuster Company. Stamford, Ct. 069120041.
– Hof, G., M.D. Vervoorn, P.L. Lenaers, and S. Tamminga. 1997. Milk urea nitrogen as a tool to monitor the protein nutrition of dairy cows. J. Dairy Sci. 80:33333340.
– Huhtanen, P. 1998. Supply of nutrients and productive responses in dairy cows given diets based on restrictively fermented silage. Agric. Food Sci. Finl. 7:219–250
– Jarvis, S.C., D.J. Hatch and D.H. Roberts. 1989a. The effects of grassland management on nitrogen losses from grazed swards through ammonia volatilization; the relationship to excretal N returns from cattle. J. agric. Sci. Camb. 112:205216.
– Jarvis, S.C., D.J. Hatch and D.R. Lockyer. 1989b. Ammonia fluxes from grazed grassland: annual losses from cattle production systems and their relation to nitrogen inputs. J. agric. Sci. Camb.113:99108.
– Jonker, J.S., R.A. Kohn, and R.A. Erdman. 1998. Using milk urea nitrogen to predict nitrogen excretion and utilization efficiency in lactating dairy cows. J. Dairy Sci. 81:26812692.Muck, R.E. and B.K. Richards. 1983. Losses of manurial N in freestall barns. Agric. Wastes 7:6579.
– Muck, R.E. 1982. Urease activity in bovine feces. J. Dairy Sci. 65:21572163.
– Muck, R.E. and F.G. Herndon. 1985. Hydrated lime to reduce manorial nitrogen losses in dairy barns. Transactions of ASAE 28:201208.
– NRC. 2001. Nutrient Requirements of Dairy Cattle. Seventh Revised Edition. National Academy Press. Washington D.C. NRC. 1996. Nutrient Requirements of Beef Cattle. Seventh Revised Edition. National AcademyPress. Washington D.C.
– Roseler, D.K., J.D. Ferguson, C.J. Sniffen and J. Herrema. 1993. Dietary protein degradability effects on plasma and milk urea nitrogen and milk nonprotein nitrogen in Holstein cows. J. Dairy Sci. 76:525534.
– Scholefield, D., D.R. Lockyer, D.C. Whitehead, and K.C. Tyson. 1991. A model to predict transformations and losses of nitrogen in UK pastures grazed by beef cattle. Plant and Soil132:165171.
– Smits, M.C.J., H. Valk, A. Elzing, and A. Keen. 1995. Effect of protein nutrition on ammonia emission from a cubicle house for dairy cattle. Live. Prod. Sci. 44:147156.
– Voorburg, J.H. and W. Kroodsman. 1992. Volatile emissions of housing systems for cattle.Livestock Prod. Sci. 31:5770.
– Wattiaux , M.A – Protein Metabolism in Dairy Cows – Babcock Institute for International Dairy Research and Development – University of Wisconsin-Madison -2014
– Wilkerson, V.A., D.R. Mertens, and D.P. Casper. 1997. Prediction of excretion of manure and nitrogen by Holstein dairy cattle. J. Dairy Sci. 80:31933204.
– Van Horn HH. 1991;Managing Dairy Manure Resources to aviod Environmental pollution. J Dairy Sci 77:2008-1994.
– Van Horn HH. Balancing nutrients, manure use reduces pollution. Feedstuffs. The Miller Publishing Co. 1992; 64(Oct. 26, 1992). 11-23. Minnetonka, MN.
– Vanfaassen HG, Lebbink G. 1994;Organic matter and nitrogen dynamics in conventional versus integrated arable farming. Agr Ecosyst Environ 51:209-26.
– Vanhorn HH, Wilkie AC, Powers WJ, Nordstedt RA. 1994;Components of Dairy Manure Management Systems. J Dairy Sci 77:2008-30. Webb J, Archer JR. ; Dewi IA, Axford RFE, Marai IFM, Omed H, editors.Pollution in Livestock Production Systems. Oxon, UK: CAB International, 1994; 11,
– Pollution of Soils and Watercourses by Wastes from Livestock Production Systems. p. 189-204.
– Young CE, Crowder BM, Shortle JS, Alwang JR. 1985;Nutrient Management on Dairy Farms in Southestern Pennsylvania. J Soil Water Conserv 40:443-445.